v1.0
Analytics
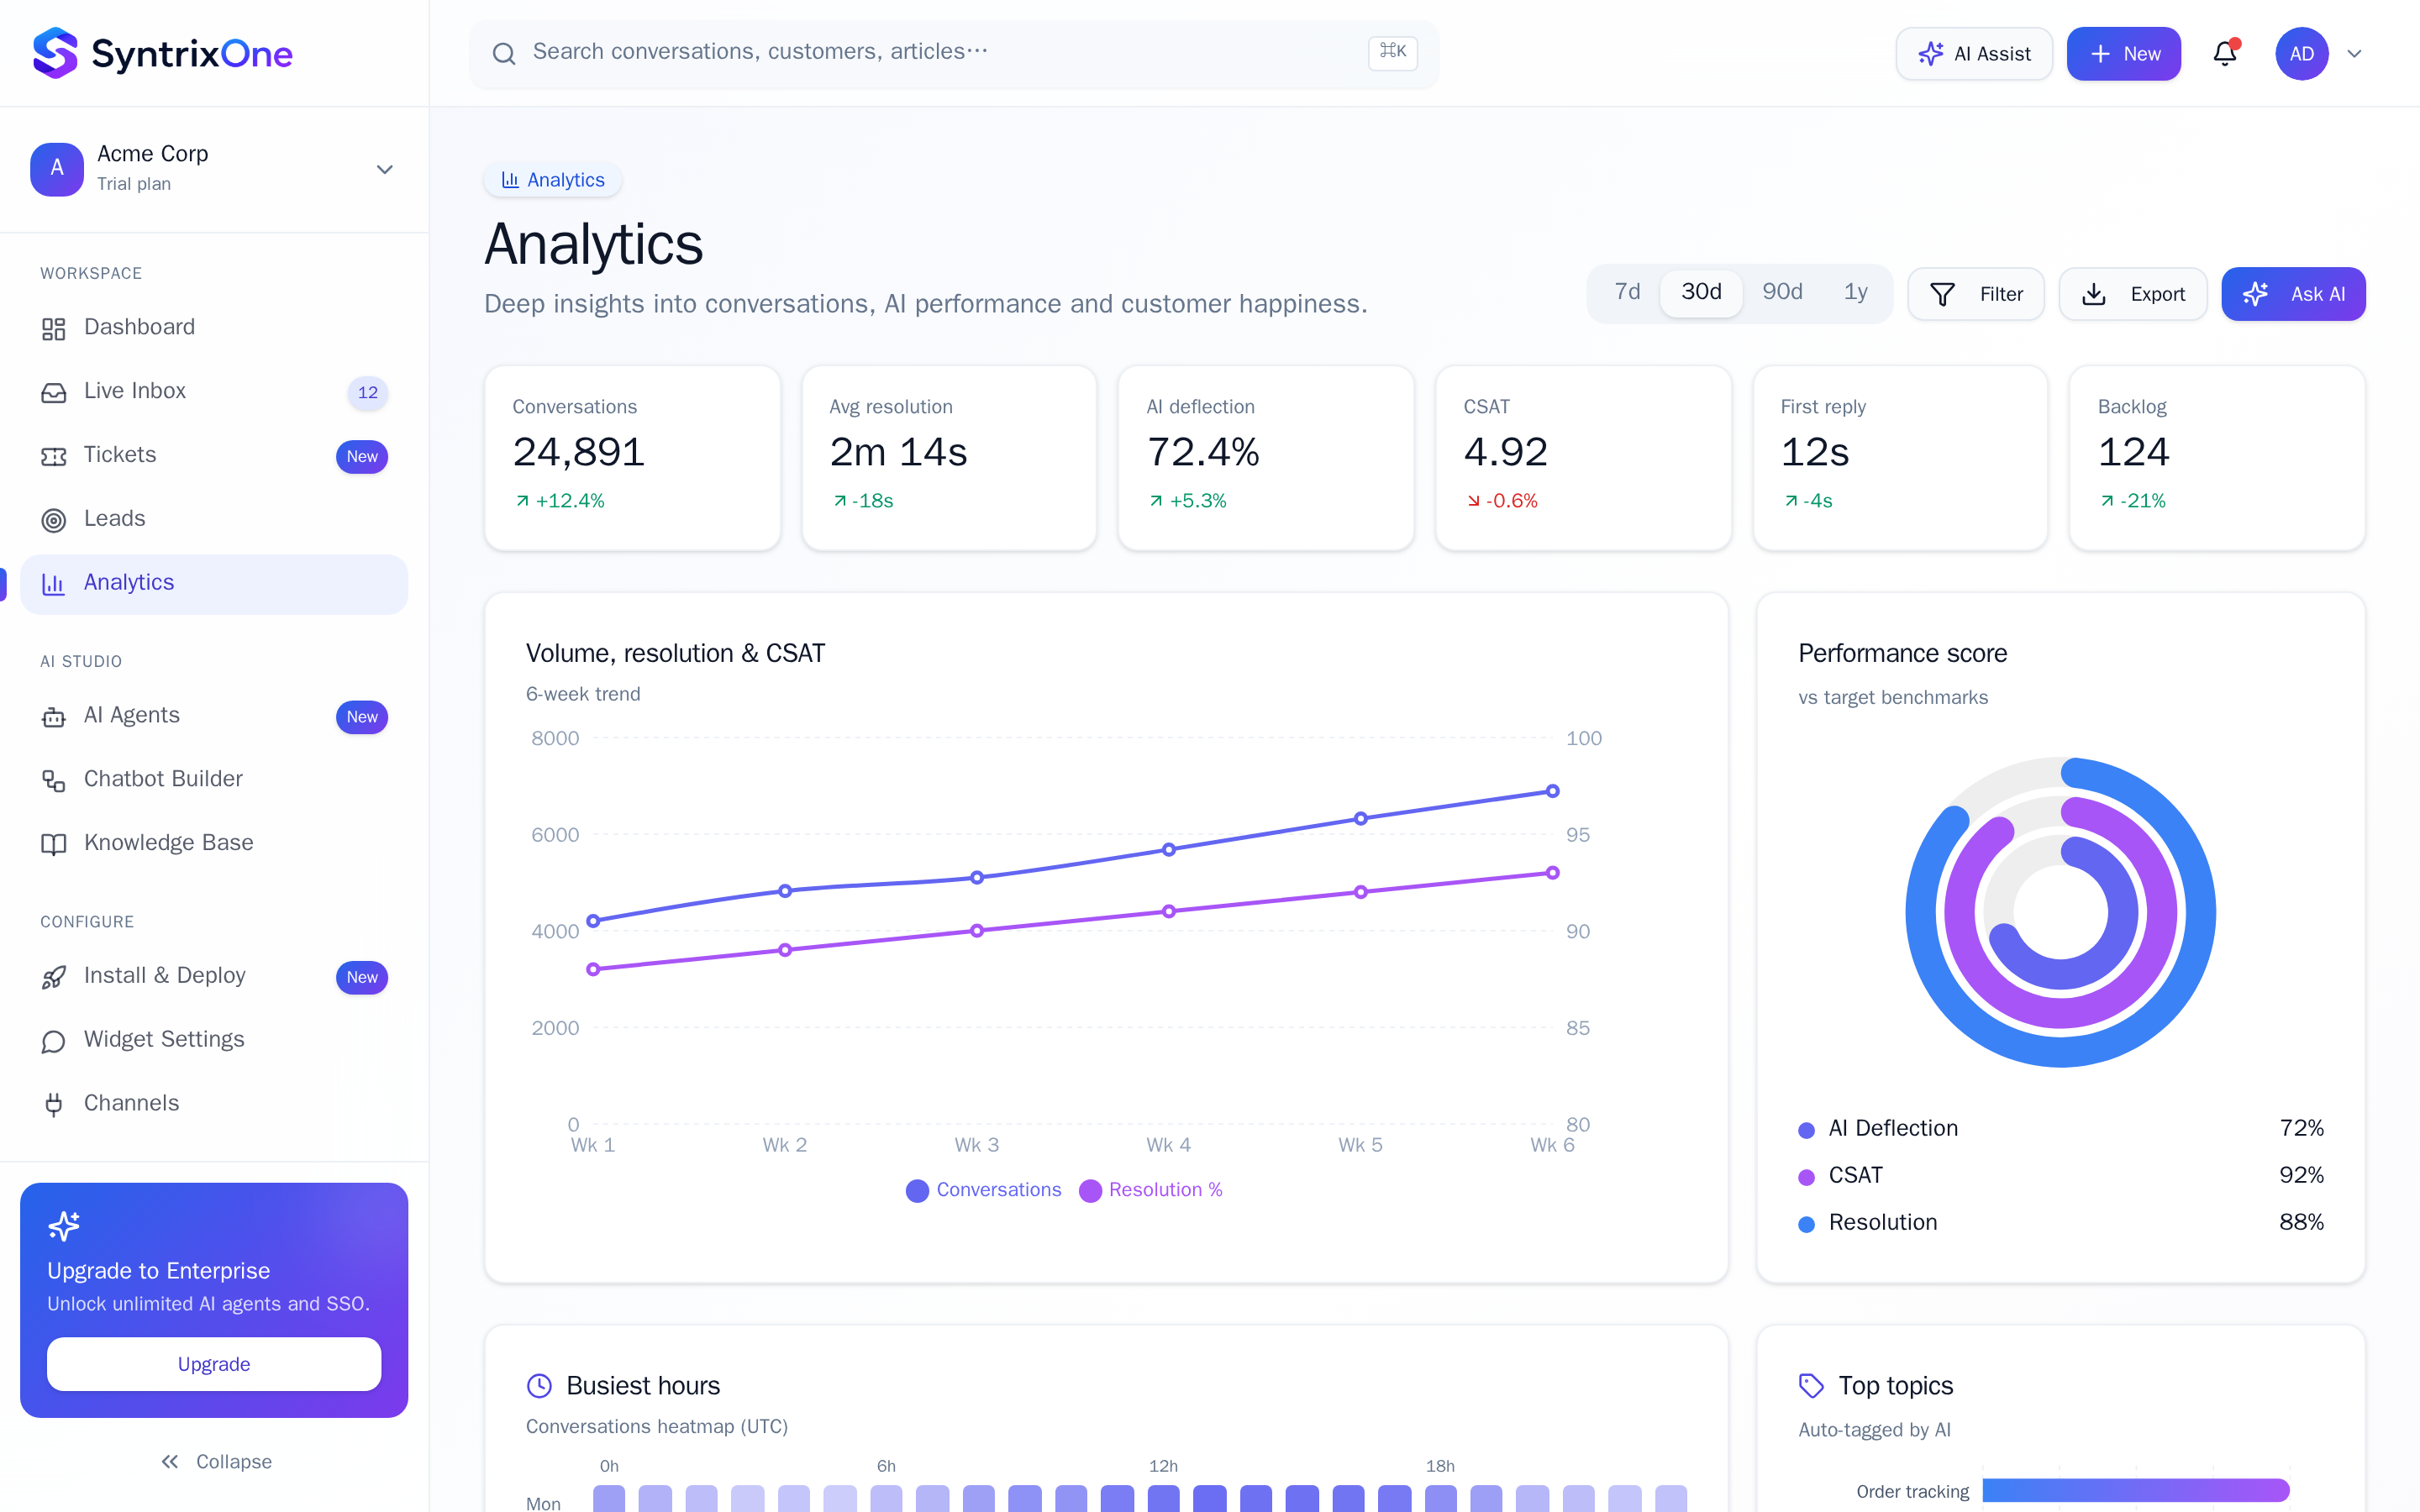
Real-time KPIs and deep-dive dashboards covering conversations, AI performance, channels, leads, and team productivity.
Quick start
Setup time
5 minutes
Prerequisites
- •Active conversations or tickets in the workspace
Outcomes
- Personal dashboard pinned
- First scheduled report exported
Step-by-step walkthrough
Numbered, real-world instructions you can follow today.
1
Open Analytics
Sidebar → Analytics. The Overview tab shows KPIs across all surfaces.
2
Filter and slice
Use the date range, channel, and team filters in the top bar. All charts update reactively.
3
Drill down
Click any KPI card to land on the dedicated report with cohort and breakdown filters.
4
Export or schedule
Click Export → CSV / PDF, or Schedule to receive a recurring email digest.
Watch tutorial
Watch: Analytics tour
Video coming soon — bookmark this page or subscribe for the release.
Tips & best practices
Field-tested advice from teams shipping SyntrixOne in production.
- Pin your team's North Star metric to the dashboard via Customise.
- Use saved segments ("Enterprise customers", "EU") to keep slices one click away.
Common issues & troubleshooting
What goes wrong, and exactly how to fix it.
Frequently asked questions
4 answers to the questions teams ask most.
Ready when you are
Explore your Analytics
Estimated setup time: 5 minutes.
Related articles
Keep going — explore the next pieces of SyntrixOne.
AI Agents
Autonomous, knowledge-grounded agents that can answer, qualify, and act on behalf of your team — 24/7.
Live Inbox
A unified, omnichannel inbox where humans and AI work side by side — assign, reply, and resolve from one screen.
Ticketing System
Track structured cases, enforce SLAs, and resolve issues with full audit trails. Built for teams who outgrow generic inboxes.
Leads CRM
A lightweight, drag-and-drop CRM purpose-built for engagement-driven sales — every lead carries its full conversation history.